Welcome to a new edition of The Finance Gem 💎
Read the unabbreviated Linkedin strategic finance insights you loved this week, and catch up on those you missed.
Today’s issue is brought to you by Fuelfinance, an FP&A solution powered by a team of financial experts. If you are looking to understand the value of your company, Fuelfinance prepared a free template based on Andreessen Horowitz's article, alongside an explanatory video. The free template is called ‘Company Valuation Calculator’ and you can download it here >> Fuelfinance is also giving away an exclusive discount for the subscribers of The Finance Gem. You can get $500 OFF the first 3 months of a Fuelfinance subscription! Just request a demo of Fuelfinance on their website and mention promo code The Finance Gem during the discovery call.
And speaking of Cash…
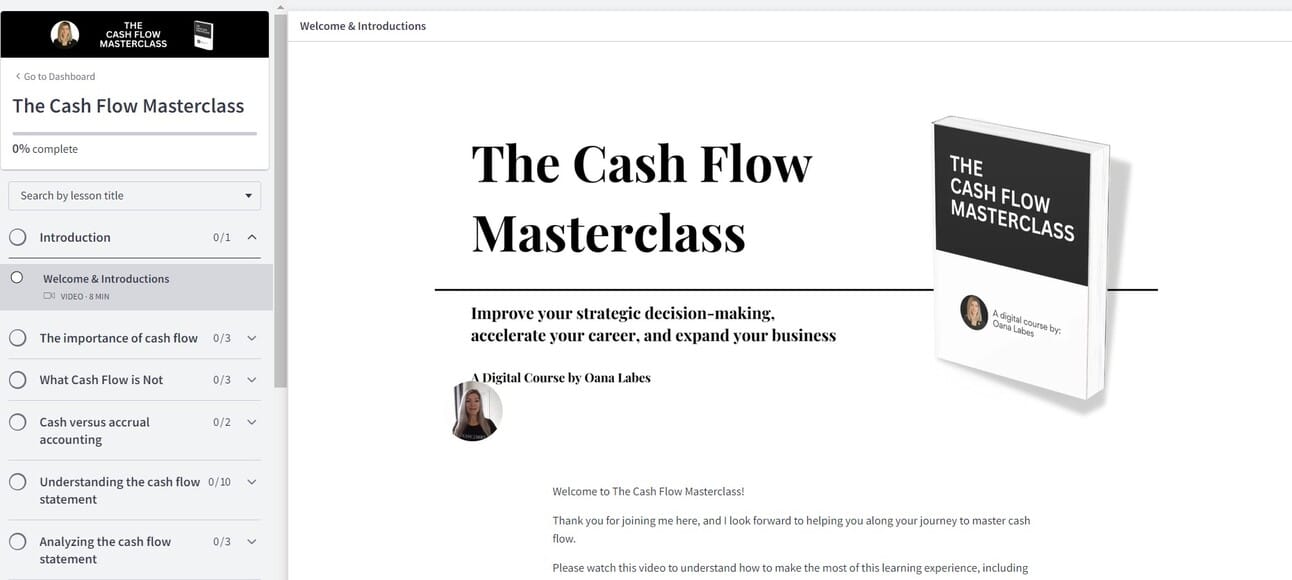
If you’re not Enrolled in my Cash Flow Masterclass you’re missing out!
Professionals just like you and from a variety of backgrounds are loving The Cash Flow Masterclass. Here’s what everyone’s saying:
“The slides, quizzes and infographics are of excellent quality with rich and practical insights that can be easily applied in our day to day life in an organization.”
“The Cash Flow Masterclass is amazing.”
“I think this course is necessary for all finance professionals. I work as a CFO but I found it very eye opening and educational to think about cash flow more often and in more ways.”
“The course is excellent.”
“I recently completed the Cash Flow Master Class online, and I must say it was an incredibly valuable experience. “
“If you're wondering if you should take this course, take it! it's great value and you will walk away with both practical skills and strategic knowledge”
“The instructor, Oana, did an excellent job of explaining these concepts in a clear and concise manner.”
Don’t get left behind!
Click below I look forward to seeing you in class!
Updates this Week
If you’re attending or planning to attend the AFP Conference in San Diego this October, please reply & let me know.
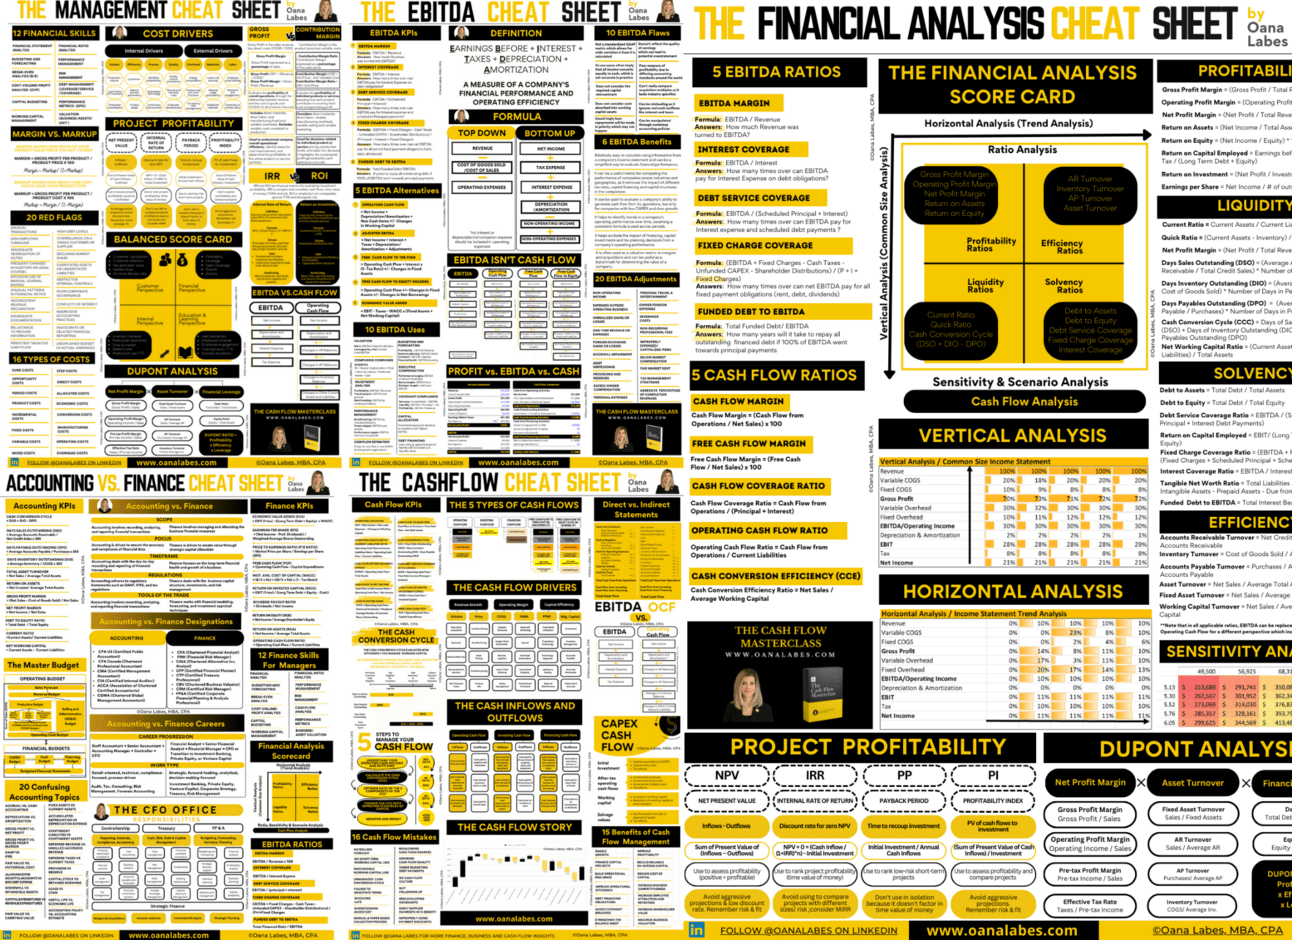
If you’re looking for printable PDF copies of my cheat sheets, checklists and infographics, visit my web store and turn your favorites into posters! Or give them as gifts and become the coolest finance buff!
I am planning another EBITDA Webinar in the fall, in partnership with CPA Ontario. Given the success of the first one, this one will be FREE but spaces will be limited. Add your name to this list to learn about it first.
If you’re on Twitter, please follow me there as well and reach out to connect: @IAmOanaLabes
This week’s Strategic Finance Insights
The CEO KPI Checklist
The Overhead ABC
EBITDA vs. EVA vs. RI
ROI vs ROE vs ROA
CAPEX vs. OPEX
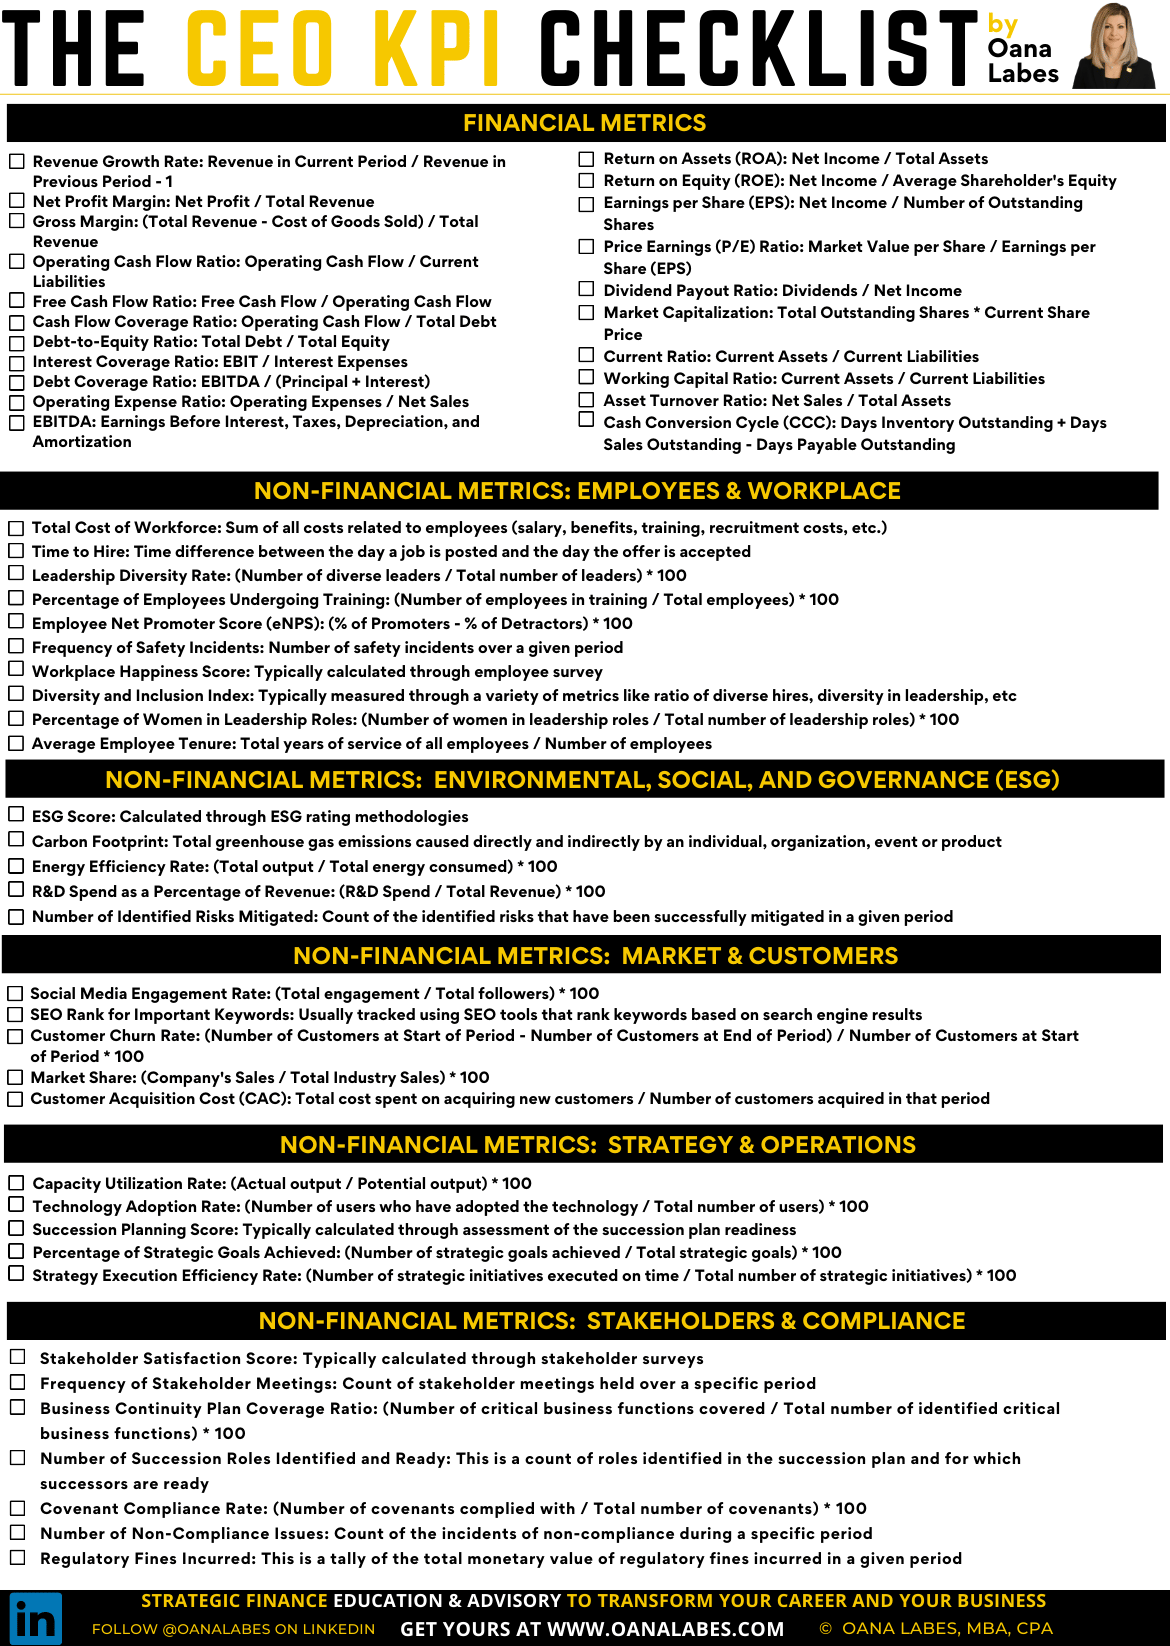
The CEO KPI Checklist
It’s tough being a CEO.
Every decision impacts financial health, employee morale, and stakeholder satisfaction.
To succeed, you’ll need to measure and monitor performance.
And to closely track everything you want to impact.
Financial and Non-Financial Metrics.
------------------------------------
Here are 50 KPIs a CEO should monitor and manage.
The Key KPIs across key 6 areas.
1. Financial Metrics
2. Non-Financial Metrics: Employees & Workplace
3. Non-Financial Metrics: Environmental, Social, and Governance (ESG)
4. Non-Financial Metrics: Market & Customers
5. Non-Financial Metrics: Strategy & Operations
6. Non-Financial Metrics: Stakeholders & Compliance
Download a PDF copy here. It’s free for you as a subscriber, but only for a limited time.
The Overhead ABC
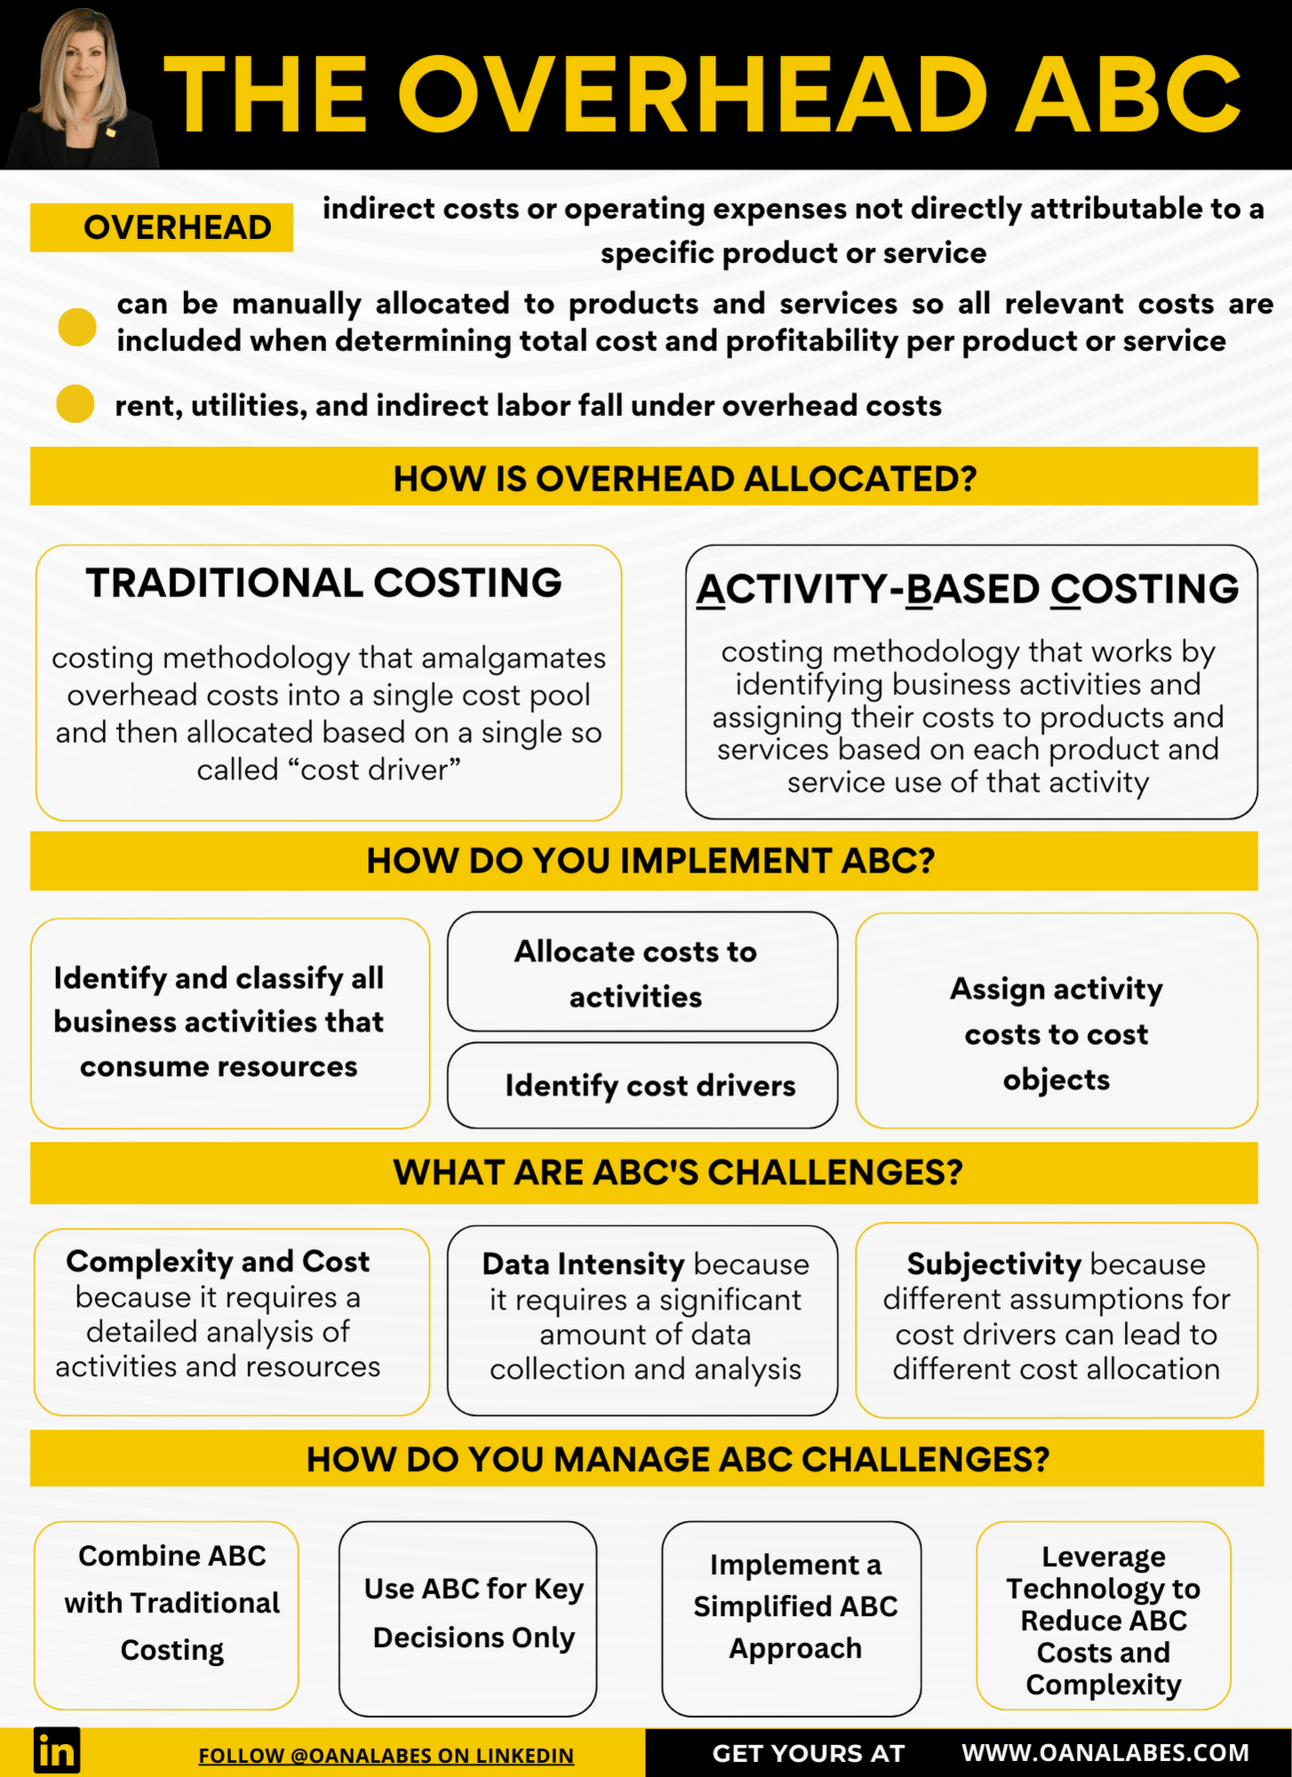
aka Activity Based Costing.
Here’s what you need to know.
🎯 What is Overhead?
Indirect costs or operating expenses not directly attributable to a specific product or service
⚫ Overhead can nevertheless be manually allocated to products and services to ensure all relevant costs are included when determining total cost and profitability per product or service
⚫ Rent, utilities, and indirect labor fall under overhead costs
🎯 How is Overhead allocated?
2 methods:
1️⃣ Traditional costing
⚫ A costing methodology where overhead costs are amalgamated into a single cost pool and then allocated based on a single so called “cost driver” like direct labor hours or machine hours
2️⃣ Activity-Based Costing (ABC)
⚫ A costing methodology that provides better cost information than traditional costing
⚫ Particularly beneficial in complex environments where resource consumption by products or services isn’t uniform
🎯 How does ABC work?
⚫ by identifying business activities and assigning their costs to products and services based on how much each product and service uses that activity
⚫ the outcome is that more indirect costs (overhead) get treated as direct costs
⚫ the benefit is that with better direct cost understanding comes better pricing for improved profitability
🎯 How do you implement ABC?
1️⃣ Identify and classify all business activities that consume resources
⚫ machinery setup, design changes, running machinery
2️⃣ Allocate costs to activities
⚫ activity costs typically represent a mix of direct and indirect costs
⚫ for example, imagine a trying to allocate the cost of running your machinery in a factory (the business activity)
>> your direct costs include labor costs of machine operators and the cost of raw materials used
>> your indirect costs include the machine depreciation, the portion of utility costs incurred to operate the machines, and the portion of the factory rent for the space occupied by the machines
>> your total cost will be the sum of the direct and indirect costs assigned to this activity
3️⃣ Identify cost drivers
⚫ cost drivers are factors that drive the cost of activities
⚫ most companies use labor hours, machine hours or number of units, but those are rarely directly driving the cost of production activities.
⚫ examples of true cost drivers include: the number of setups, the square footage, the number of purchase orders, the number of design changes
4️⃣ Assign activity costs to cost objects
⚫ use the identified cost drivers to allocate the costs of the various business activities to the cost objects (products or services) that made use of that activity
🎯 What’s challenging about ABC?
Several things.
⚫ Complex and Costly because it requires a detailed analysis of activities and resources
⚫ Data Intensity because it requires a significant amount of data collection and analysis
⚫ Subjective because different assumptions for cost drivers can lead to different cost allocations, potentially reducing the consistency and comparability of cost information
🎯 What’s the middle ground between ABC and Traditional Cost Allocations?
It’s complicated, but here’s what you can try.
⚫ Use ABC for Key Decisions Only and apply selectively for critical, strategic decisions vs company-wide implementation
⚫ Combine ABC with Traditional Costing and use traditional costing for routine financial reporting and ABC for internal decision-making
⚫ Implement a Simplified ABC Approach where you choose a less intricate ABC model by grouping similar activities or using broader cost drivers
⚫ Leverage Technology and rely on software and ERP systems to reduce the ABC implementation costs and complexity by automating data collection and analysis
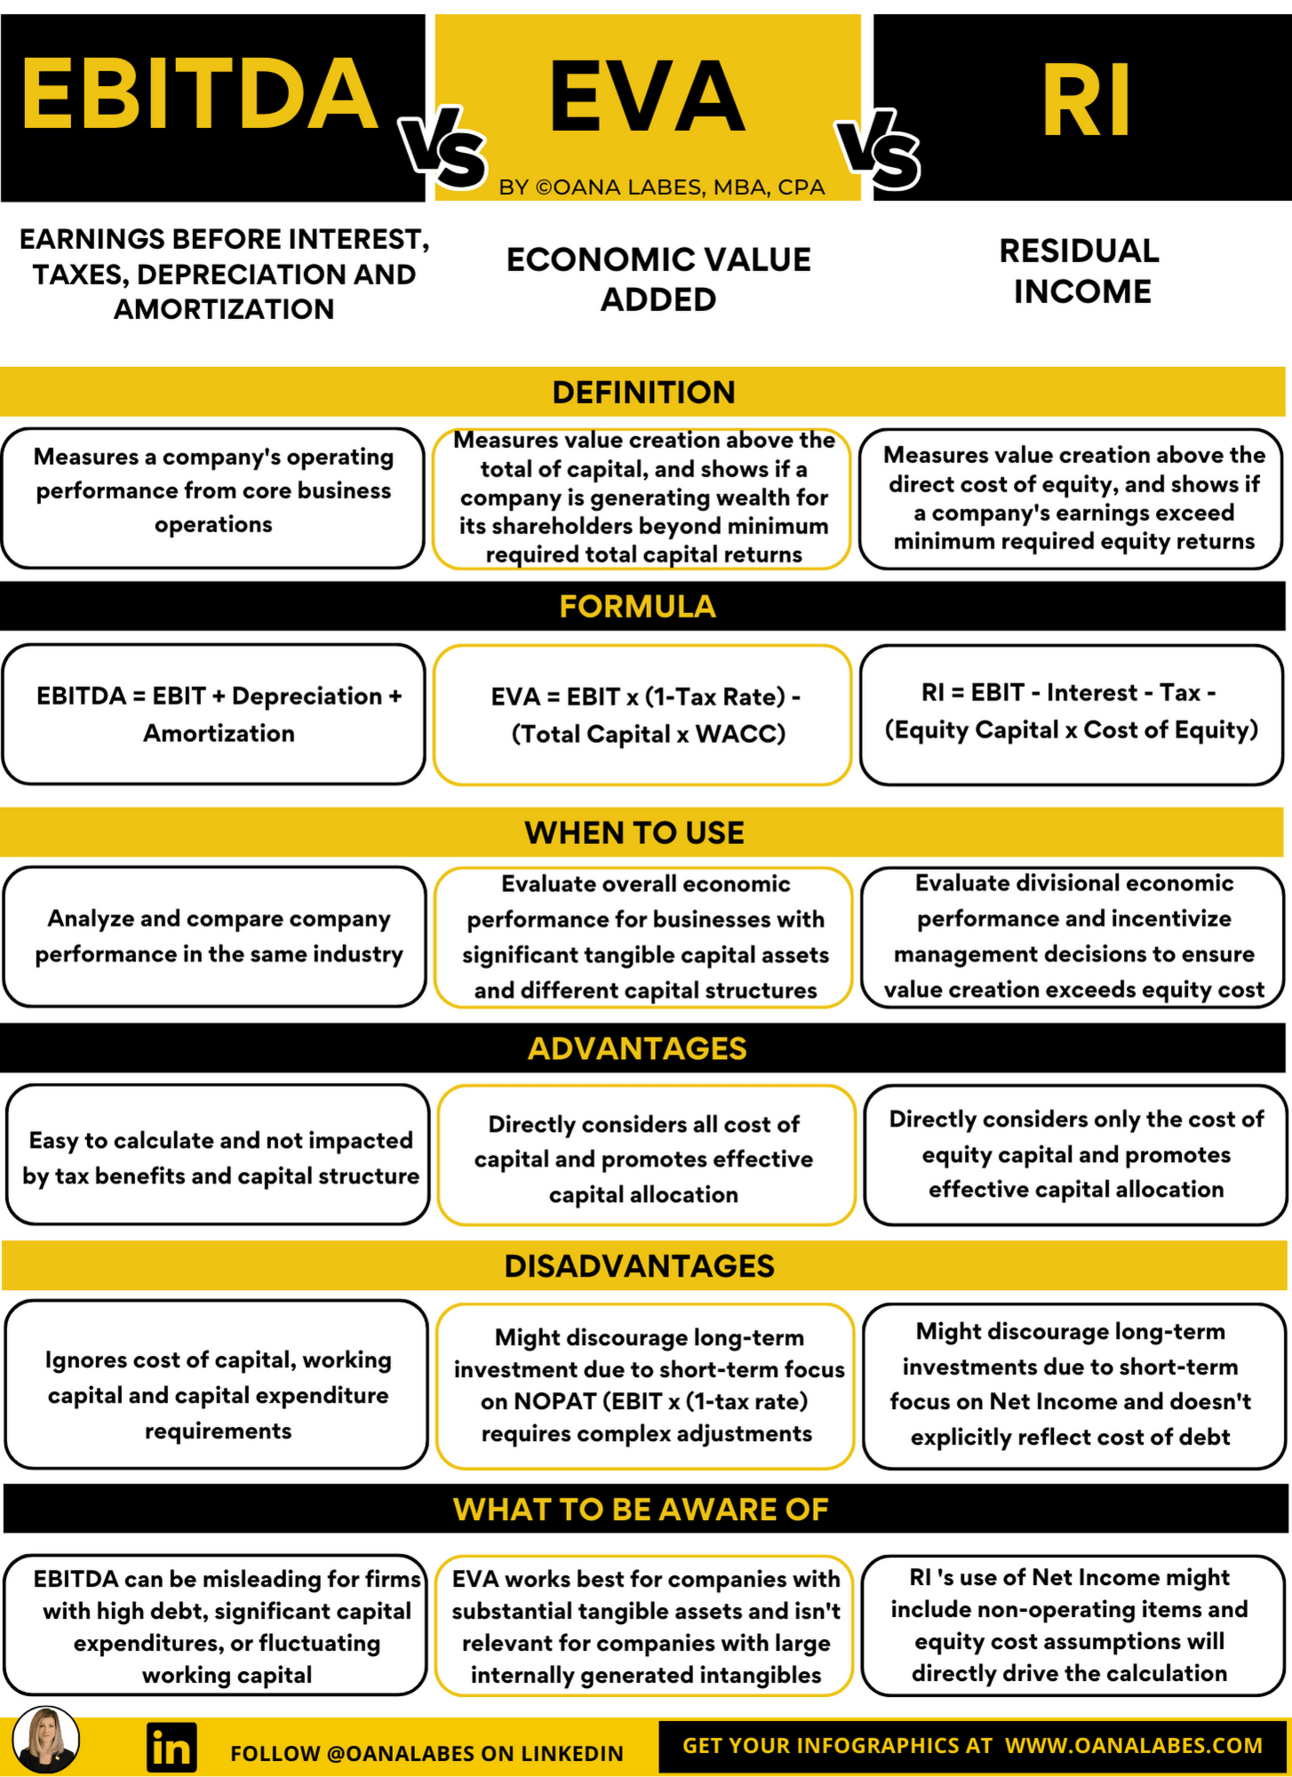
EBITDA vs. EVA vs. RI
Are your accounting profits sufficient to cover:
🎯 the opportunity cost of equity
🎯 the opportunity cost of debt
🎯 or both?
The short answer is:
❌EBITDA pays no rent.
⚫ RI pays explicit rent to shareholders.
✅ EVA pays rent to shareholders and debt holders.
The “rent” is the opportunity cost of capital required to get from Accounting Profit to Economic Profit.
➡️ If economic profit is positive, it means the company is generating returns above the opportunity cost of all resources used, not just the costs recorded on the books
But
➡️ EBITDA doesn’t account for any opportunity costs.
➡️ RI explicitly accounts for only for the cost of equity capital.
➡️ Only EVA accounts for the opportunity cost of both debt and equity capital.
🎯Here’s what you need to know:
1️⃣ Earnings Before Interest, Taxes, Depreciation, and Amortization (EBITDA)
- Formula: EBITDA = EBIT + Depreciation + Amortization
- Caveat: EBITDA does not consider the cost of capital (debt or equity) and might also provide a distorted picture of financial health, especially for companies with high levels of debt or substantial capital investment needs
2️⃣ Economic Value Added (EVA)
- Formula: EVA = EBIT x (1-Tax Rate) - (Total Invested Capital * Cost of Capital)
- Caveat: EVA might be less relevant for companies whose value primarily comes from internally generated intangible assets (like intellectual property or brand recognition), as these are not traditionally recognized on the balance sheet or factored into the cost of capital
3️⃣ Residual Income (RI)
- Formula: RI = EBIT - Interest - Tax - (Equity Capital * Cost of Equity)
- Caveat: The accuracy of RI is highly dependent on the cost of equity estimation plus it does not expressly consider the cost of borrowing, making it less suitable for companies with significant levels of debt.
🎯 So which one should you use?
Ideally, EVA at the company level, RI at the divisional level.
🎯 And what about EBITDA?
Don’t use it to assess value creation.
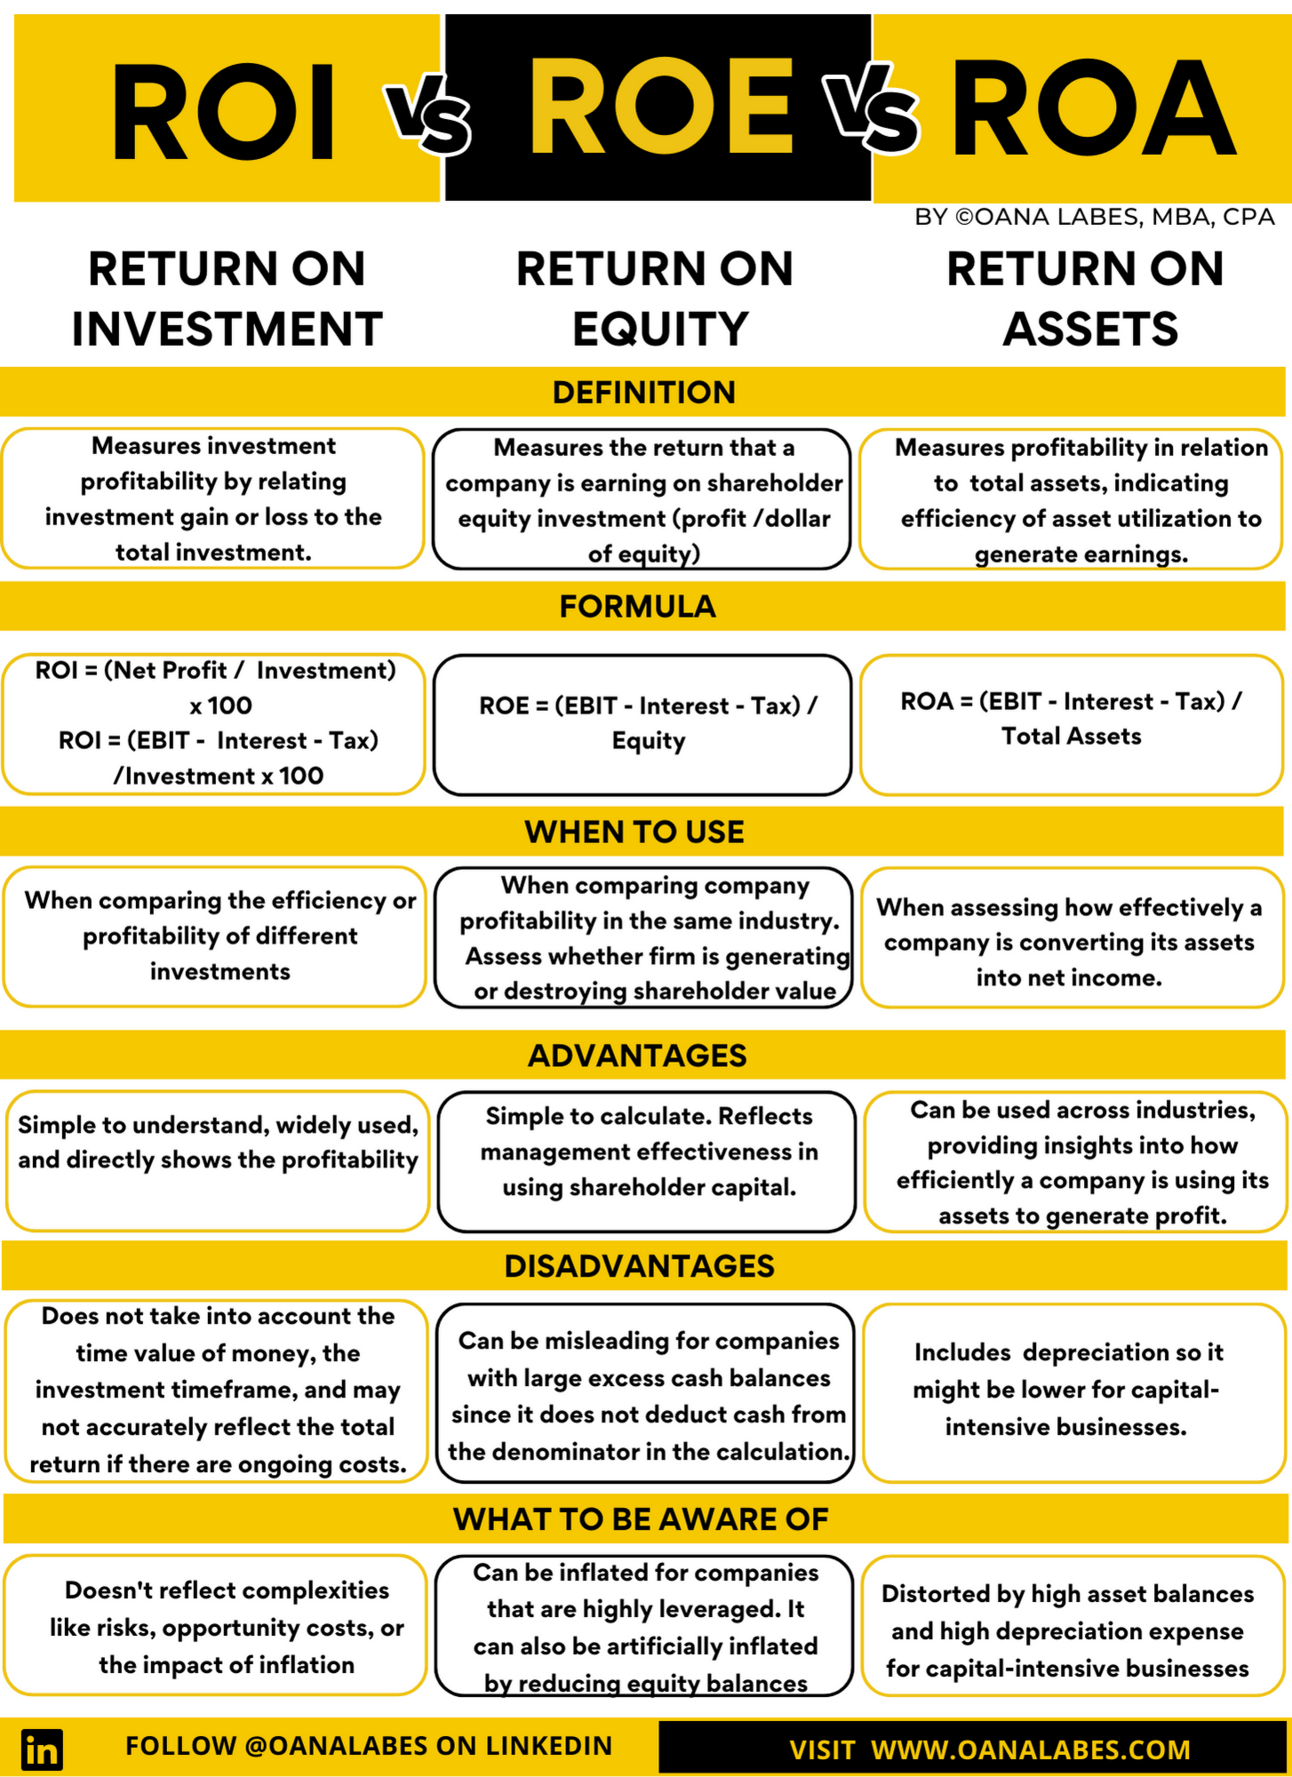
ROI vs ROE vs ROA
A trifecta of powerful financial metrics to help you assess:
➡️ the profitability of an investment
➡️➡️ the effectiveness of total asset management
➡️➡️➡️ the efficiency of a company's use of shareholders' equity
But beware:
⚫ ROI distorts profitability and could lead to financial trouble, because it doesn't consider the time value of money and it doesn't account for risks involved in the investment
⚫⚫ ROE can be manipulated by management decisions that artificially reduce equity (share buybacks) and could lead to deteriorating business financial health by encouraging management to take on too much debt in the effort to increase returns
⚫⚫⚫ ROA could also lead to deteriorating business financial health by ignoring asset financing choices (debt vs equity) and it can also make comparisons across industries challenging by coming in disproportionately low for capital-intensive businesses
🎯Here’s what you need to remember:
1️⃣ Return on Investment (ROI)
- Formula: ROI = (Net Profit / Cost of Investment) * 100%
- Caveat: ROI doesn't consider the time value of money, which makes it less useful for multi-period investments, plus it ignores the investment risk profile
2️⃣ Return on Equity (ROE)
- Formula: ROE = (EBIT - Interest - Tax) / Equity
- Caveat: ROE can be heavily inflated by excessive use of leverage and artificially reduced equity balances
3️⃣ Return on Assets (ROA)
- Formula: ROA = (EBIT - Interest - Tax) / Total Assets
- Caveat: ROA includes depreciation so it will be lower for capital-intensive businesses which already have higher Total Asset balances
CAPEX vs. OPEX
CAPEX vs. OPEX
Capitalizing vs. Expensing
Here’s what you need to know:
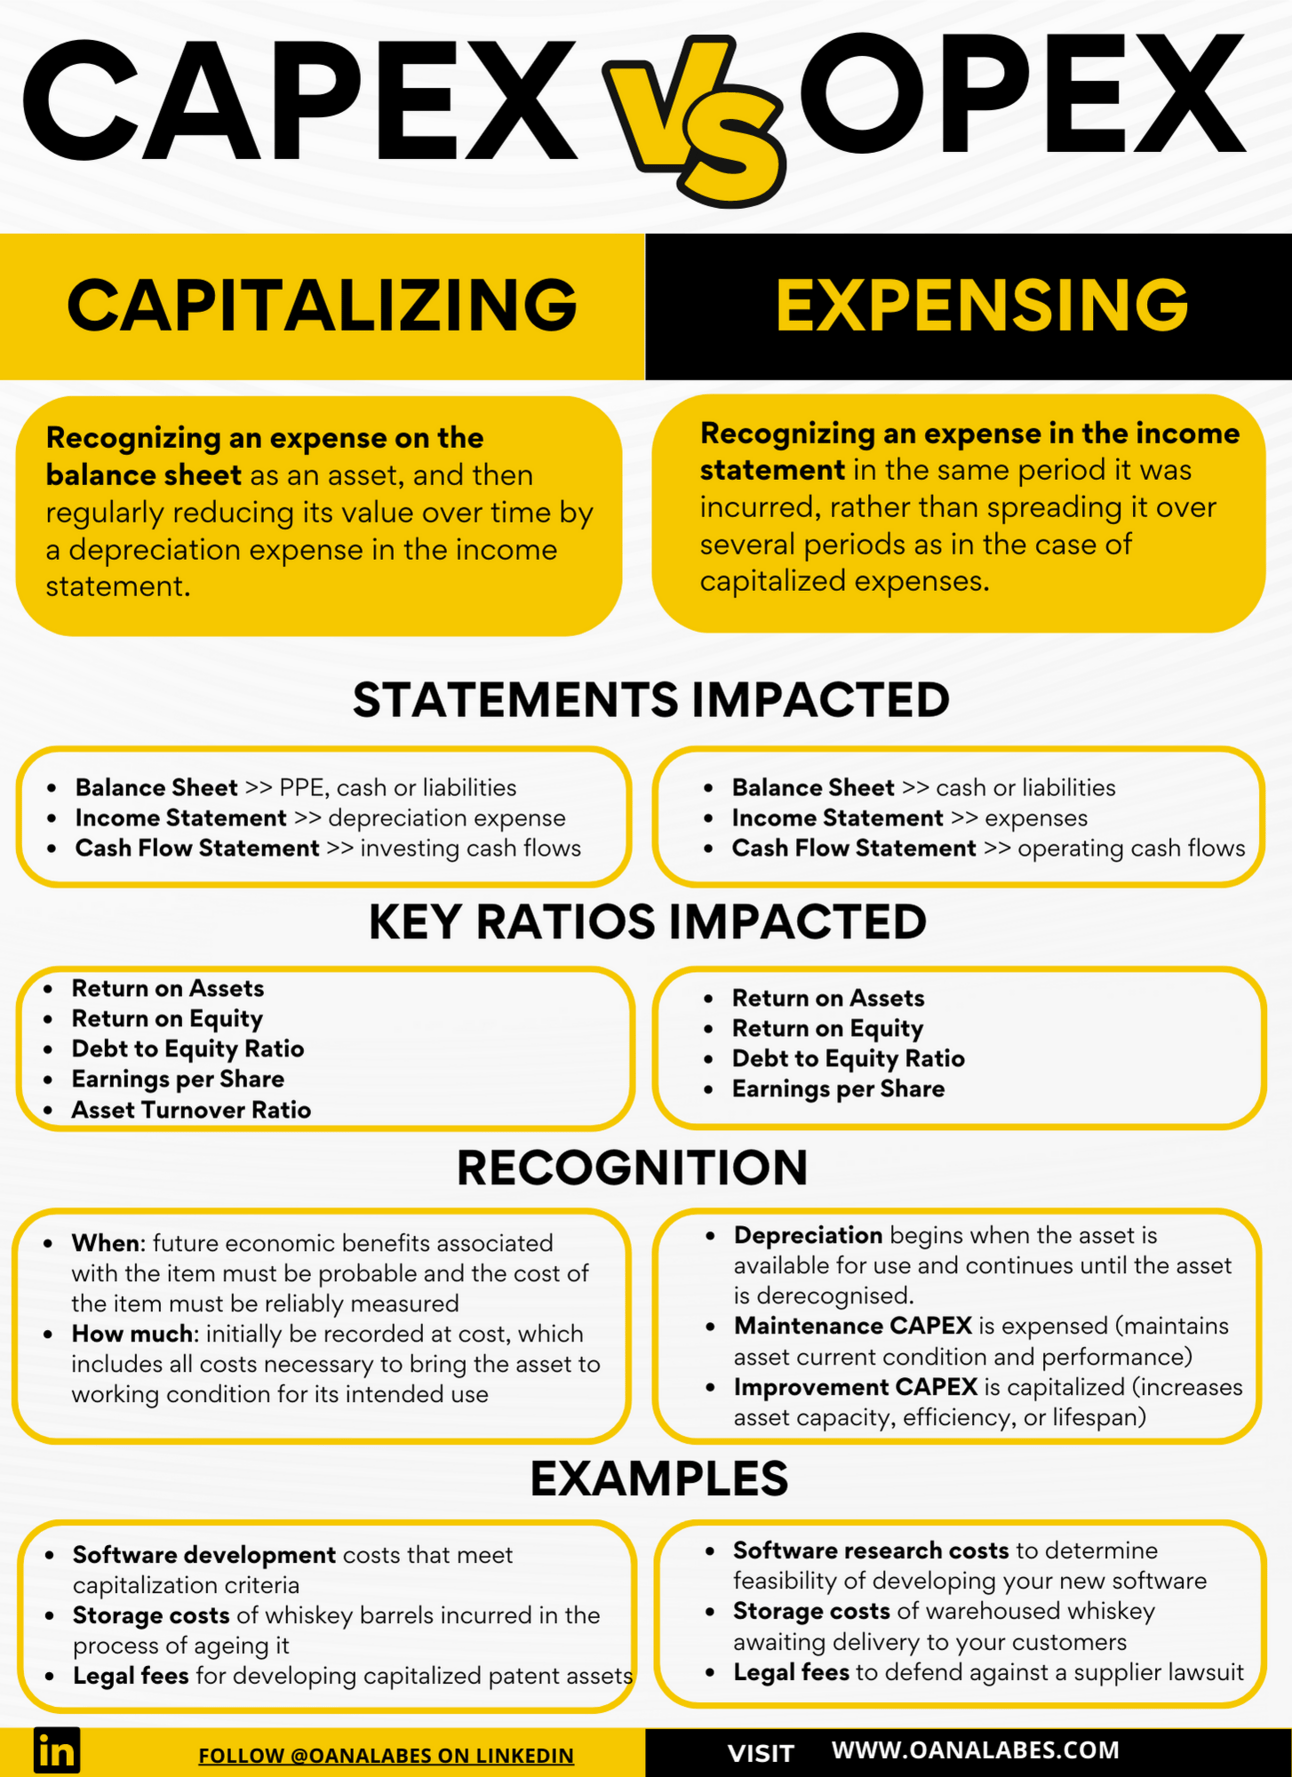
Capitalizing = recognizing a cost on the balance sheet as an asset, and then regularly reducing the value of that asset by a depreciation expense on the income statement.
Statements impacted:
⚫Balance Sheet >> increased non-current asset balance
⚫Income Statement >> reduced profitability from increased depreciation expense
⚫Cash Flow Statement >>increased investing cash flows, and reduced ending cash balance or increased financing cash flows
Key ratios impacted:
⚫Return on Assets
⚫Return on Equity
⚫Debt to Equity Ratio
⚫Asset Turnover Ratio
⚫Earnings per Share
Examples:
➡️ software development costs that meet capitalization criteria
➡️ storage costs of whiskey barrels incurred in the process of ageing it
➡️ legal fees for developing your capitalized patent assets
Expensing = recognizing an expense on the income statement in the same period it was incurred, rather than spreading it over several periods as in the case of capitalized expenses.
Statements impacted:
⚫Income Statement >> reduced profitability from higher total expenses
⚫Balance Sheet >> reduced cash balance or increased liabilities
⚫Cash Flow Statement >> reduced operating cash flows
Key ratios impacted:
⚫Return on Assets
⚫Return on Equity
⚫Debt to Equity Ratio
⚫Earnings per Share
⚫Interest Coverage Ratio
Examples:
➡️ research costs to determine feasibility of developing your new software
➡️ storage costs of warehoused whiskey awaiting delivery to your customers
➡️ legal fees to defend against a supplier lawsuit
Key questions to answer:
- When to recognize: when future economic benefits associated with the item are probable and the cost of the item must be reliably measured
- How much to recognize: initially must be recorded at cost, which includes all costs necessary to bring the asset to working condition for its intended use
- When to start depreciation: when the asset is available for use and continues until the asset is derecognized.
- What about maintenance CAPEX: it is expensed (maintains asset current condition and performance)
- What about improvement CAPEX: it is capitalized (increases asset capacity, efficiency, or lifespan)
- What about Tax implications:
- expensing the cost of an item reduces the business taxable income, and lowers the tax payment for that year
- capitalizing the cost of an item spreads the tax benefit over the useful life of the asset with only the annual tax depreciation expense being available to reduce the business’s taxable income every year
How did you enjoy this week's newsletter?
Want more strategic finance insights?
Upgrade your (or your team’s) strategic finance skills with The Cash Flow Masterclass. Leverage my unique on-demand video course to improve your knowledge, elevate your decision making and accelerate your career. For customized team training please apply here.
Sponsor a future issue of The Finance Gem 💎and get your brand in front of an exceptional audience of strategic finance, accounting, sales and technology professionals and executives.
Thanks so much for reading. See you next week.
Oana

