
Welcome to this week's edition of The Finance Gem 💎 where I bring you my unabbreviated Linkedin insights you loved - so you can save them, and those you missed - so you can enjoy them.
This newsletter edition is brought to you by Financiario - The Financing Advisory Firm for Growing Businesses. Financiario supports the vision of CEOs and expands the capacity of CFOs, to help companies plan and manage their financing requirements. They prepare strategic financial models and financing memorandums that help companies plan strategically, they help expedite the closing of financing transactions, and they enable you to position your business for long term profitability, solvency and liquidity. Check out some case studies on their Blog.
I'm excited to share that I'm currently working on several on-demand digital courses and a live cohort-based course for you over the next few weeks and months. 2023 will be full of exciting surprises, lots of new strategic finance content for you to love, and many opportunities to join me in live sessions on Linkedin. Stay tuned for the pre-sale announcements!
This week's strategic finance insights:
Without further ado, let's begin:
1// DuPont Analysis
🎯 A profitability analysis method that breaks down your company's return on equity (ROE) into three components: net profit margin, asset turnover, and financial leverage.
It essentially shows:
☑️ the proportion of sales you keep
☑️ the efficiency with which you utilize your assets to generate sales
☑️ the extent to which you rely on borrowed funds to finance those assets
ROE = Net Profit Margin x Asset Turnover x Leverage Ratio
Net Profit Margin = Net Income / Sales
Asset Turnover = Sales / Average Total Assets
Leverage Ratio = Average Total Assets / Average Shareholders' Equity
2// Economic Value Added (EVA)
🎯 A financial performance measure that calculates the difference between your company's returns and its cost of capital.
☑️ It essentially shows the amount of value your company has created for its shareholders
EVA = Net Operating Profit After Taxes (NOPAT) - (Cost of Capital x Total Invested Capital)
NOPAT = Earnings before Interest and Taxes (EBIT) x (1 - Tax Rate)
Total Invested Capital = Total Assets - Current Liabilities (excluding short-term debt)
Cost of Capital = Weighted Average Cost of Capital
3// Return on Investment (ROI)
🎯 A measure of an investment profitability that calculates your return as a percentage of your initial investment.
☑️ It essentially shows the proportion of the profit or loss you made on an investment relative to its initial cost
ROI = (Net After Tax Cash Flow from Investment - Cost of Investment) / Cost of Investment
4// Debt-to-Equity (D/E) Ratio
🎯 A financial ratio used to assess financial leverage
☑️ It essentially shows you the proportion of your company's total debt in relation to the shareholders' equity and provides insight into the financial structure and risk profile of your business.
Debt to Equity = Total Liabilities / Total Equity
5// Gross Profit Margin
🎯 A financial ratio used to assess profitability
☑️ It essentially shows the percentage of revenue after discounts, returns and cost of goods sold which your company gets to keep.
Gross Profit Margin = (Gross Profit / Net Revenue) x 100
6// Earnings Before Interest, Taxes, Depreciation, and Amortization (EBITDA) and Adjusted EBITDA
🎯 A financial metric that measures your company's profitability by excluding the effects of financing, tax, or accounting policy choices. Often adjusted to reflect the economic reality of your company or its peers.
☑️ It essentially shows you the operating performance of your company by measuring its cash driven earnings derived from core business activities.
EBITDA = Net (Operating) Income + Taxes + Depreciation + Amortization + Interest
Adjusted EBITDA = EBITDA +/- Adjustments (Non-Cash Expenses, Provisions, Contingent liabilities, One-time expenses/revenues)
7// Operating Profit Margin
🎯 A financial ratio that measures your company's operating efficiency by dividing its operating profit by its net revenue.
☑️ It essentially shows the percentage of revenue after discounts, returns, cost of goods sold and operating expenses which your company gets to keep.
Operating Profit Margin = (Operating Profit / Net Revenue) x 100
8// Net Profit Margin
🎯 A financial ratio that measures your company's profitability by dividing its net profit by its net revenue.
☑️ It essentially shows the percentage of revenue after discounts, returns, cost of goods sold, operating expenses, interest and taxes which your company gets to keep.
Net Profit Margin = (Net Profit / Net Revenue) x 100
9// Price-to-Earnings (P/E) Ratio
🎯 A financial ratio used in valuation which compares your company's stock price to its earnings per share.
☑️ It essentially shows you the valuation of your company by comparing its current share price to its earnings per share.
(P/E) Ratio = Market Price per Share / Earnings per Share
10// Cash Flow Analysis
🎯 A financial analysis method to evaluate your company's financial health by analyzing the cash sources and uses of funds from operations, investing and financing over a specific period of time.
☑️ It essentially shows you where the cash is coming into your business and how it’s being used by your business.
Net Cash Flow = Operating Cash Flow + Investing Cash Flow + Financing Cash Flow
11// Net Present Value (NPV)
🎯 A financial metric used to assess the profitability of an investment or project.
☑️ It essentially shows whether the present value of your company's expected cash inflows exceeds the present value of its expected cash outflows.
NPV = present value of cash inflows - present value of cash outflows
12// Cost Volume Profit Analysis (CVP)
🎯 A financial management tool used to analyze the relationship between your company's sales volume, costs, and profits.
☑️ It essentially shows you your break-even point and analyzes the impact of changes in costs, prices, and sales volume on your company's profitability.
Contribution Margin = Sales Revenue - Variable Costs
Contribution Margin Ratio = Contribution Margin / Sales Revenue
Break-Even Point (in units) = Fixed Costs / Contribution Margin per Unit
Break-Even Point (in dollars) = Fixed Costs / Contribution Margin Ratio
Profit Target = (Fixed Costs + Profit Target) / Contribution Margin Ratio
13// Payback Period
🎯 A financial metric that measures the length of time it would take for your investment to recover the initial costs.
☑️ It essentially shows you the amount of time it would takes for an investment you made to recover its initial cost
Payback Period = Initial Investment / Annual Cash Inflows
14// Internal Rate of Return (IRR)
🎯 This is the discount rate that makes your Net Present Value for a particular investment equal to zero.
☑️ It essentially shows you the annualized percentage rate of return at which your investment's net present value becomes zero
15// Cash Conversion Cycle (CCC)
🎯 A financial metric that measures the time it takes for y9our company to convert its investments in inventory and AR into cash.
☑️ It essentially shows you the time it takes for your company to convert its investments in inventory and accounts receivable into cash, while accounting for the time it takes to pay suppliers.
CCC = Days Sales Outstanding (DSO) + Days Inventory Outstanding (DIO) - Days Payable Outstanding (DPO)
16// Return on Assets
🎯 An financial metric measuring the total earnings as a proportion of your total assets
☑️ It essentially shows you how efficiently your company is using its assets to generate profits and create value for shareholders.
ROA = (Net Income / Average Total Assets) x 100
17// Debt Service Coverage Ratio
🎯 An indicator of your company’s ability to meet its fixed debt payment obligations of principal and interest.
☑️ It essentially shows your company's ability to meet its debt obligations by comparing its operating income to required principal and interest payments
DSCR = EBITDA / (Principal + Interest)
18// Return on Invested Capital
🎯 A financial metric that measures your company's ability to generate returns on the capital invested in the business.
☑️ It essentially shows the percentage of profit generated from your company’s invested capital (both equity and debt).
ROIC = (Net Operating Profit After Taxes (NOPAT)) / (Total Debt + Total Equity - Cash and Cash Equivalents) x 100
19// Weighted Average Cost of Capital (WACC)
🎯 A financial metric that calculates the overall cost of your company's capital, including both equity and debt, weighted by the proportion of each in the company's capital structure
☑️ It essentially shows the average rate of return your company is expected to pay to its capital providers, as well as the minimum rate of return it should aim to generate in order to create value for its shareholders.
WACC = (Cost of Equity x % Equity) + (Cost of Debt x % Debt) + (Cost of Preferred Stock x % Preferred Stock)
20// Dividend Payout Ratio
🎯 A financial ratio that measures the proportion of your company's earnings that are paid out as dividends to shareholders.
☑️ It essentially shows you the percentage of your company's earnings that gets distributed to shareholders in the form of dividends as opposed to retained in the business to fund growth and other objectives.
Dividend payout ratio = Dividends Paid / Net Income

20 Management Analysis Tools you Need to Know - Oana Labes, MBA, CPA
Do you know what they are, how to calculate them, and most importantly, how to use them?
☑️ ROIC (Return on Invested Capital) and ☑️ ROCE (Return on Capital Employed) are frequently used in financial performance analysis to assess how profitably and efficiently your company is investing its capital
☑️ These ratios are easily confused because, at first glance, they appear to be very similar.
☑️ Here’s how they’re different:
🎯 ROIC measures profitability through NOPAT, while ROCE measures profitability through EBIT
🎯 ROIC measures the after tax return earned on the total long-term capital invested
🎯 ROCE measures the return earned on the total long-term capital employed
☑️ Here’s how to calculate them:
🎯 ROIC = EBIT (1-tax) / (Long Term Debt + Equity - Cash)
🎯 ROCE = EBIT/ (Long Term Debt + Equity)
☑️ Here’s how they compare to other similar return ratios:
🎯 ROCE vs. ROE:
ROCE measures the return on your company's entire long term capital invested, taking into account both equity and debt financing sources
ROE measures the return on your company's equity financing only during a period
🎯 ROIC vs. ROI:
ROIC measures the return on your company's entire long term capital invested, taking into account both equity and debt financing sources
ROI measures the individual return on an investment or portfolio of investments
☑️ Here’s how to use ROIC vs ROCE
🎯 ROIC is calculated after tax and excludes cash balances (deemed to be non-operating assets), so it’s useful as a profitability and efficiency measure from your investors’ perspective
🎯 ROCE is calculated before tax, so it’s useful as a profitability and efficiency measure from your company’s perspective, as well as to compare different companies independent of their tax jurisdictions

ROIC vs. ROCE - Oana Labes, MBA, CPA
Financial Distress describes a circumstance where your business may be unable to fulfill its current cash obligations.
In other words, you don’t have not enough cash on hand or otherwise flowing in time to pay your suppliers, employees, and debt payments when they come due.
🎯 Here are 10 recognizable symptoms of financial distress.
💎 While any one of these will hardly be sufficient to suggest your company is in financial distress, the presence of several of these factors likely will.
1️⃣ Difficulty in paying bills on time
What does this mean: your company is not generating enough cash to meet current payment obligations, which could lead to serious consequences such as legal action or contractual defaults
2️⃣ Decrease in sales or revenue
What does this mean: your company may be forced to take on debt or other financing options to cover financial payment obligations, which can further exacerbate the situation
3️⃣ Rising short-term debt and accounts payable
What does this mean: your company could end up relying on short-term financing options, which can be expensive and can lead to financial distress in the long run
4️⃣ Low (or no) cash balances
What does this mean: this too can lead to a situation where your company is forced to take on debt or other financing options to meet its obligations
5️⃣ High debt-to-equity ratio
What does this mean: it can be excessively difficult for your company to generate adequate profits because interest payments on debt will dramatically reduce earnings
6️⃣ High debt-to-asset ratio
What does this mean: this too will indicate that your company is highly leveraged and may have difficulty using its assets to generate sufficient profits, which will strain the business and increase the risk of defaulting on debt obligations
7️⃣ Low or negative profit margins
What does this mean: this can indicate that your company is either operating inefficiently or facing increased competition for its products and services
8️⃣ Decline in share prices
What does this mean: investors are probably losing confidence in your company, which make it difficult to raise capital to meet financing requirements
9️⃣ Decrease in credit and risk ratings
What does this mean: your company is deemed to have an elevated risk profile; this will make it difficult to secure financing at favorable rates and may prompt you to take on expensive alternative financing options
🔟 Negative operating cash flow
What does this mean: if your company is not generating enough cash from operations to cover its expenses, which can indicate either inefficient operations or increased rivalry between market competitors.
🎯 How do you know if your company is in danger?
🎯 Use the Altman Z-score to predict the probability of your company going bankrupt or experiencing financial distress within the next two years.
Z = 1.2A + 1.4B + 3.3C + 0.6D + 1.0E
Where:
A = working capital / total assets
B = retained earnings / total assets
C = earnings before interest and taxes (EBIT) / total assets
D = market value of equity / book value of liabilities
E = sales / total assets
🎯 The Altman Z-score:
⚫ measures your company's financial health by analyzing its liquidity, profitability, leverage, solvency, and other factors
⚫ is considered save if >3
⚫ if between 1.8 and 3 it indicates caution
⚫ if below 1.8 it indicates a high risk of financial distress.
⚫ is not infallible so use it in conjunction with other financial health tracking metrics

10 Signs of Financial Distress - Oana Labes, MBA, CPA
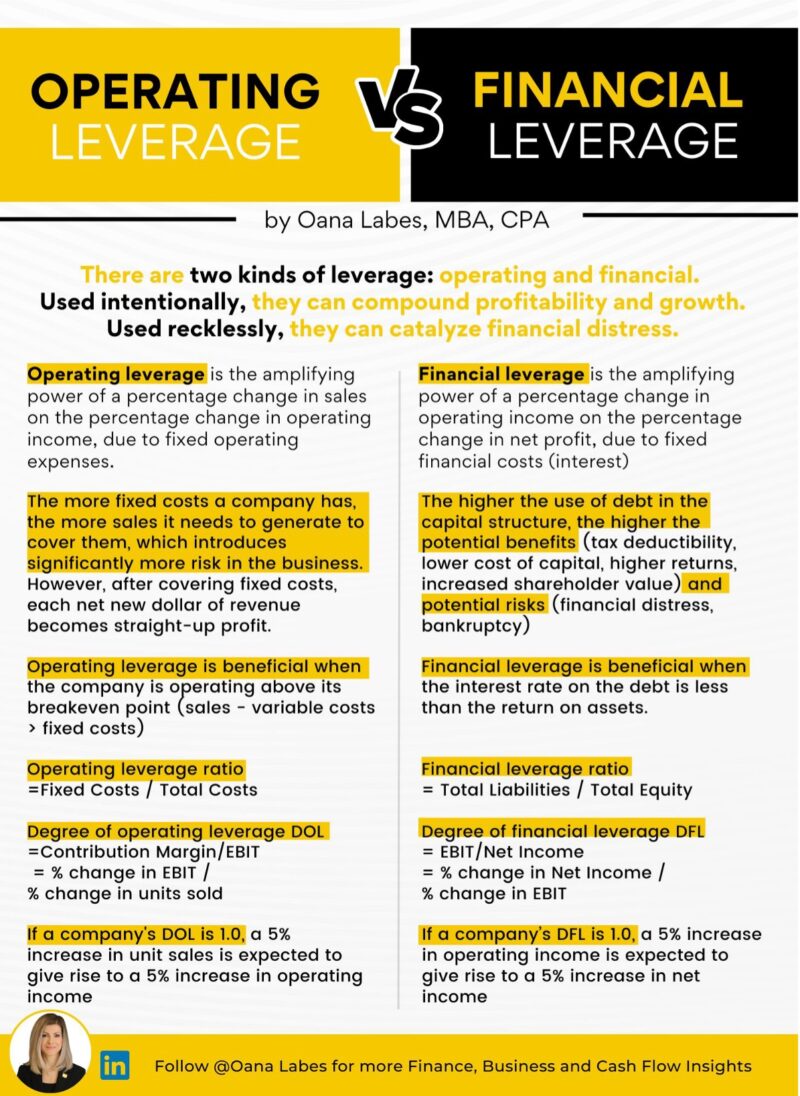
You have 2 main Controls to improve Business Profitability and avoid Distress.
Many companies use them jointly to compound profitability and growth, but they can be as deadly as they are attractive.
Do you know what they are?
𝗢𝗽𝗲𝗿𝗮𝘁𝗶𝗻𝗴 𝗟𝗲𝘃𝗲𝗿𝗮𝗴𝗲 𝗮𝗻𝗱 𝗙𝗶𝗻𝗮𝗻𝗰𝗶𝗮𝗹 𝗟𝗲𝘃𝗲𝗿𝗮𝗴𝗲.
They have the power to amplify the company's earnings in both directions.
🎯 Modest increases in revenue can greatly enhance earnings.
🎯 Modest drops in sales can trigger dramatic losses.
1️⃣ 𝗢𝗽𝗲𝗿𝗮𝘁𝗶𝗻𝗴 𝗹𝗲𝘃𝗲𝗿𝗮𝗴𝗲 𝗶𝘀 𝗽𝗿𝗼𝗱𝘂𝗰𝗲𝗱 𝘁𝗵𝗿𝗼𝘂𝗴𝗵 𝘁𝗵𝗲 𝘂𝘀𝗲 𝗼𝗳 𝗳𝗶𝘅𝗲𝗱 𝗼𝗽𝗲𝗿𝗮𝘁𝗶𝗻𝗴 𝗲𝘅𝗽𝗲𝗻𝘀𝗲𝘀 (𝘀𝘂𝗰𝗵 𝗮𝘀 𝗿𝗲𝗻𝘁 𝗼𝗿 𝗱𝗲𝗽𝗿𝗲𝗰𝗶𝗮𝘁𝗶𝗼𝗻).
🎯 High fixed costs >> High Operating Leverage >> Low variable costs >> High Gross Margins
🎯 The more fixed costs your company has, the more sales it needs to generate to cover them, which introduces significant risk in the business.
🎯 However, after you've covered fixed costs for the period, each new dollar of sales net of variable costs trickles straight into profit.
🎯 For operating leverage to be beneficial, your company must be operating above its breakeven point (sales - variable costs > fixed costs)
2️⃣ 𝗙𝗶𝗻𝗮𝗻𝗰𝗶𝗮𝗹 𝗹𝗲𝘃𝗲𝗿𝗮𝗴𝗲 𝗶𝘀 𝗽𝗿𝗼𝗱𝘂𝗰𝗲𝗱 𝘁𝗵𝗿𝗼𝘂𝗴𝗵 𝘁𝗵𝗲 𝘂𝘀𝗲 𝗼𝗳 𝗯𝗼𝗿𝗿𝗼𝘄𝗲𝗱 𝗰𝗮𝗽𝗶𝘁𝗮𝗹 𝘄𝗵𝗶𝗰𝗵 𝗴𝗲𝗻𝗲𝗿𝗮𝘁𝗲𝘀 𝗳𝗶𝘅𝗲𝗱 𝗳𝗶𝗻𝗮𝗻𝗰𝗶𝗮𝗹 𝗰𝗼𝘀𝘁𝘀 (𝘀𝘂𝗰𝗵 𝗮𝘀 𝗶𝗻𝘁𝗲𝗿𝗲𝘀𝘁 𝗲𝘅𝗽𝗲𝗻𝘀𝗲).
🎯 Financial leverage picks up where operating leverage leaves off.
🎯 The higher the leverage, the higher your potential benefits (tax deductibility, lower overall cost of capital, higher potential shareholder value created) and potential risks (bankruptcy, financial distress, decreased valuation).
🎯 Financial Leverage is typically measured with the use of leverage ratios like Debt to Equity, Debt to Assets, or Debt to EBITDA.
🎯 For financial leverage to be beneficial, your return on assets must exceed the interest rate on your debt.
𝐓𝐨𝐠𝐞𝐭𝐡𝐞𝐫, 𝐎𝐩𝐞𝐫𝐚𝐭𝐢𝐧𝐠 𝐋𝐞𝐯𝐞𝐫𝐚𝐠𝐞 𝐚𝐧𝐝 𝐅𝐢𝐧𝐚𝐧𝐜𝐢𝐚𝐥 𝐋𝐞𝐯𝐞𝐫𝐚𝐠𝐞 𝐦𝐚𝐤𝐞 𝐮𝐩 𝐭𝐡𝐞 𝐃𝐞𝐠𝐫𝐞𝐞 𝐨𝐟 𝐓𝐨𝐭𝐚𝐥 𝐋𝐞𝐯𝐞𝐫𝐚𝐠𝐞.
🎯 During periods of economic slowdown, a high degree of leverage can greatly increase business risk and the probability of financial distress.
🎯 Consider:
☑️paying down debt or refinancing to reduce fixed payment obligations
☑️temporarily switching fixed expenditures to variable as appropriate for your business

Operating Leverage vs. Finance Leverage - Oana Labes, MBA, CPA
Read the article I wrote about this exact topic for the Corporate Finance Institute here:
1️⃣ It’s not depreciation.
In finance, it refers to the repayment of a loan over time.
In accounting, it means expensing or writing off the cost of an intangible asset over time.
2️⃣ It’s not always needed.
Loans can be amortizing or non-amortizing.
With an amortizing loan, you pay back the loan balance gradually over time.
With non-amortizing loans, you only pay interest throughout the loan term and repay the principal amount through a lump sum at the end.
3️⃣ It’s not always regular.
In personal finance, the amortization of a loan is always done through regular payments throughout the life of the loan
In commercial finance, the payments can be regular or irregular, tailored to the cash flow patterns of the business.
4️⃣ It’s critically important.
There are multiple financial implications for loan amortizations:
✅ they reduce free cash flows available to service other debt, invest in business growth, or fund capital distributions to shareholders.
✅ they increase the risk of default of the business.
✅ they require careful cash flow planning to ensure adequate funding of payments.
✅ they require careful budgeting to ensure the business generates adequate profits to afford the payments.
5️⃣ It can cost you a great deal.
Amortizing loans can be repaid through either blended payments or Principal + Interest payments.
Blended payment arrangements establish equal monthly payments of principal and interest over an agreed-upon amortization period.
Principal + Interest arrangements establish a fixed principal payment amount every month and a variable interest payment amount on top of that.
Guess which option makes the lender the most money and costs you the most in interest expense?
6️⃣ The accounting can be complex.
The accounting of loans amortizing through blended payments requires you to:
✅ split every blended payment and estimate the principal and interest amounts
✅ apply the principal payment to reduce the associated liability
✅ expense the interest cost.
Beyond these regular accounting entries, year-end adjustments are almost always needed to bring the ending period loan balances in line with the lender statement.

6 Things you Need to Know about Amortization - Oana Labes, MBA, CPA
Some next steps for you to consider:
Sponsor this newsletter - reply to this email with subject line "Sponsorship" to partner with me and bring your business in front of a highly engaged professional community made up of CFOs, CEOs, CPAs, MBAs, FMVAs, Controllers, Finance Managers, Presidents, Business Owners, and upcoming leaders.
Forward this newsletter - to help your network enjoy it the way you do. Your friends and colleagues will appreciate your thoughtfulness and will respect your deep knowledge of finance.
Subscribe to The Finance Gem 💎- to receive my newsletter directly next week, in case this email was forwarded to you by one of your thoughtful friends or colleagues.
Thanks so much for reading. See you next week.